Home Page Image


The SIMS-SS Dating Method


Introduction

The Obsidian Hydration Dating (OHD) method is based upon modelling the rate of water diffusion into a natural glass surface and establishing a diffusion coefficient for this process. It is accepted that the rate of water diffusion, the diffusion coefficient, is exponentially dependent on temperature and exhibits an Arhenius type behaviour. A variety of strategies have been developed over the years to calibrate the movement of ambient water into glass.

However, the development of calibrations to compensate for variation in external variables has proven to be difficult. This has been the major impediment to making OHD a fully chronometric dating method comparable to radiocarbon dating.

We have evaluate a procedure for obsidian age estimation that is based upon the depth and shape of the hydrogen diffusion profile as determined by Secondary Ion mass Spectrometry (SIMS). We have termed this approach SIMS-SS since the primary input variable, which controls the water in the mass of obsidian, is the saturation achieved in the surface layer (SS).

To demonstrate the accuracy of this method, we have selected 31 case samples (figure 4) from around the world that incorporate a wide variety of different obsidians and environmental regimes.


Water Diffusion in Obsidian

The diffusion of water in obsidian takes place with two mechanisms.
The first mechanism, is through the external surface of obsidian which is in direct contact with its surrounding. This mechanism is defined as the initial mass transport between a layer of resistance on the surface, from the surroundings to the external surface.
The second mechanism, is the transport of water into the obsidian mass, in other words, the diffusion of water in obsidian.
It should be stated that the first mechanism is the mass transport through a film on the surface. The mass transport in this surface film is much faster than the mass transport in the solid body. This phenomenon is due to the fact that, in the first case, the humidity transport from the surrounding is made through the air layer, existing between the surrounding and obsidian. This air layer exerts much smaller resistance to water diffusion than the solid obsidian.

The model of water diffusion in amorphous silicates developed by Doremus is the most appropriate descriptor of water diffusion in glass at low temperature because it accounts for the patterning in much of the experimental data. In a vapour environment molecular water enters the glass network and reacts with the silicon-oxygen network to form SiOH groups:

Si-O-Si + H2O = SiOH + OHSi

As the molecular water moves through the glass the newly formed OH groups remain relatively fixed. It is assumed that the OH group formation lags well behind the movement of mobile water molecules but eventually reaches equilibrium.

The diffusion of water in amorphous silicates is also strongly correlated with the concentration of water within the surface hydration layer and is referred to as concentration-dependent diffusion.
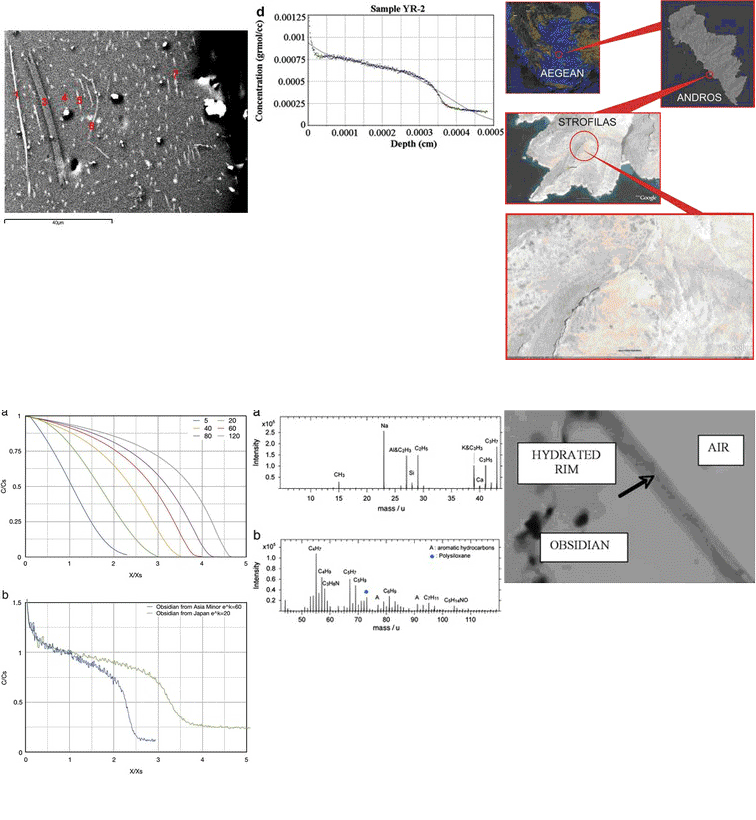
Under ambient temperatures (0-30 oC) the diffusion of water in obsidian is not a steady state diffusion process with a constant D, and cannot be mathematically estimated with Fick's first law. Instead, as water enters the glass network the structure is depolymerized and allows additional water to enter the glass at a faster rate. This changing diffusion coefficient results in the formation of a characteristic S-shaped concentration-depth profile (Figure 1).


Figure 1. The S-Shaped water profile, Strofilas satlement, Andros Island, Greece


The SIMS-SS dating method in brief

In order to model the form of the diffusion profile Crank’s theoretical diffusion curves were consulted. They derive from the solution of a differential equation that describes the diffusion process, based on the modelling of the water distribution into the obsidian surface. A detailed presentation of the mathematics involved is given elsewhere, here in brief we introduce the main points of the deduced diffusion age equation.
For the non-steady state condition considered here, a collection of sigmoid shaped curves have been produced for non-dimensional distance and concentration. Our SIMS profiles were re-plotted as non-dimensional (standardized to 1) diagrams of C/Cs versus x/xs and were matched to the appropriate profile of our produced curves guided by the end point of C along the x-axis (Figure 2). This way a k-value can be calculated from any particular sigmoid shape. A curve is then fitted to the SIMS data and takes the form of a polynomial with exponential terms. The water diffusion coefficient at any particular moment is expressed by the first derivative of the hydrogen profile. Its inverse ratio is the apparent hydration rate. The average Xs and Cs obtained from the determination of the SS layer gives the overall error attached to the SIMS-SS ages.


Figure 2. Comparison of the non-dimensional profile with the Crank curves


Using the end product of diffusion, a phenomenological model has been developed, based on certain initial and boundary conditions and appropriate physicochemical mechanisms, that express the H2O concentration versus depth profile as a diffusion / time equation. The modelling of this diffusion process is a one-dimensional phenomenon, whereas the H2O molecules invade a semi-infinite medium in a perpendicular direction to the surface. The model is based on the idea that in the SS layer met near the sample surface, that is, in the first half of the sigmoid curve, the C is assumed as constant along a very short distance. Thereafter C gradually decreases following the trend of the sigmoid.
In brief, the three principia for dating are, a) the comparison of a non-dimensional plot with a family of curves of known exponential diffusion coefficients (Fig. 2), b) the correlation between the rate of transfer (diffusion) from the surface with the diffusion duration, the saturation concentration Cs, the intrinsic (pristine) water concentration Ci, the diffusion coefficient Ds (defined the flux/gradient, where gradient or tangent= dC/dx), and following Boltzmann’s transformation and auxiliary variables, and c) the modelled curve of diffusion profile (Concentration Versus Depth).

The dating equation, incorporating all the abovementioned parameters is:

where, Ci is the intrinsic concentration of water, Cs the saturation concentration, dC/dx the diffusion coefficient for depth equal to zero, Ds,eff the effective diffusion coefficient as the effective value of the diffusion coefficient Ds for C=Cs and k is derived from the family of Crank’s curve (figure 2).


The SIMS-SS dating procedure
The SIMS-SS dating procedure, is separated into 4 major stages.

First Stage: To calculate the Saturation Layer's attributes. They are several deferent ways to locate the Saturation Surface layer.
The easiest way is to run successive linear Regressions in the diffused part of the profile and for SS layer to choose the area with the maximum number of continuing data points with linear regression value (slope) near zero (figure 3). In this area, the mean value of the concentrations and their standard deviation (sd) is calculated in order to produce the Saturation Concentration (Cs) and the mean value of the depths also with their standard deviation in order to define the saturation depth (Xs). Last, the mean value of the 10-20 last points of the tail along with standard deviation is calculated and the intrinsic concentration (Ci) is obtained.


Figure 3. Successive linear Regressions between the 20th and the 60th data point. Saturation Layer is indicated with a green box.


Second Stage: To calculate the best 3rd order fitting polynomial of the SIMS profile.
This is the most time-consuming part of the dating procedure. The fitting polynomial is needed in order to calculate the Dsureff coefficient and the dC/dx, for x=0. In order to choose the best fitting polynomial we run multiply polynomial fittings in the SIMS profile. For every fitting we cut 2-3 points from the very initial part of the profile and the unuseful part of the tail. As best fitting polynomial we choose the 3rd order polynomial with the highest Rsqr value.

Third Stage: We calculate the k value of the age equation, by comparing the non-dimensional plot of the profile with the Crank's curves (figure 2).
The comparison with the Crank's curves return a value of ek, but in the age equation we have k, so a log(ek) calculation is needed. The Ds and dC/dx parameters are calculated by the program entering the polynomial coefficients, in the SIMS-SS softawe and on-line tool.

Final Stage: Implantation of the above mentioned parameters (Cs,Xs,Ci,k, Ds, dc/dx) to the age equation, calculates the age in years before prepsent and error is evaluated from the Taylor's Rules for the error propagation.


Figure 4. Ages (y.B.P.) calculated with SIMS-SS software versus Archaeological expected ages for 31 obsidian artifacts from all over the world. (Greece, Japan, Chile, Mexico, Asia Minor, West New Britain)


Criteria for obtaining a correct age result

1. The artifact to be analyzed by Atomic Force Micorscopy (AFM) and Secondary Electron Microscopy (SEM) for the investigation of the surface. A surface area with small roughness is needed for the application of the SIMS measurement.

2. The investigation of the SIMS profile for high disturbed areas. Such profiles indicate:

a) surface anomalies (cracks, deep voids, etc)
b) excistance of crystallites inside the obsidian surface
c) disturbed diffusion during burial time


Copyright © 2008-2009 Laboratory of Archaeometry University of the Aegean. All Rights Reserved.